|
Table of Contents (click on any topic)
'Securities To View'
Drop-down Menu Functions
Loading preferred stocks into the 'View
Table'
Viewing checked
rows
Creating your own filter - the PSL
search engine
Loading
securities from your watchlist
Loading
securities from your Call Alert List (CDx3 Notification Service
subscribers only)
Entering or
editing the symbols to be viewed
'Hover and Click' Features
Viewing
the CDx3 Compliance Score
Viewing price
charts (two types)
Viewing rate of
return calculations and using the yield calculator
Viewing dividend
history
Working With Your List
Searching for a specific preferred
stock or company
Sorting
Identifying securities with Qualified
Dividend Income (QDI) status
Identifying
called (redeemed) securities
Identifying
securities with suspended or deferred dividends
Selecting a yield
calculation (Current Yield, Yield-To-Call, Effective Annual Return)
Refreshing "perishable" data in the
'View Table'
Printing a hardcopy
'Save As' Drop-down Menu
Functions
Saving a symbol watchlist
Saving a
spreadsheet (.csv format)
Saving a
Call Alert List (CDx3 Notification Service subscribers only)
Preferred Stock ListTM
disclaimer
'Securities To View' Drop-down Menu Functions
Preferred Stock ListTM allows you to perform massive
data gathering of the 1,000 to 2,000 U.S.-traded preferred stocks and
Exchange Traded Debt Securities or just one preferred stock that you
are interested in or everything in between.
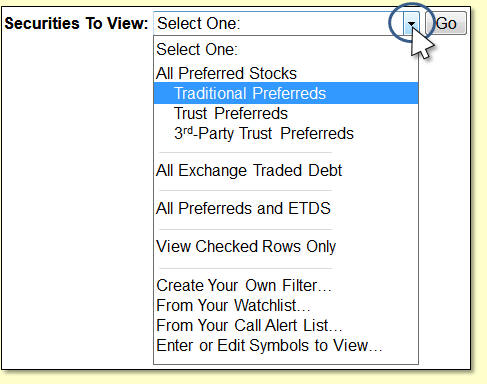
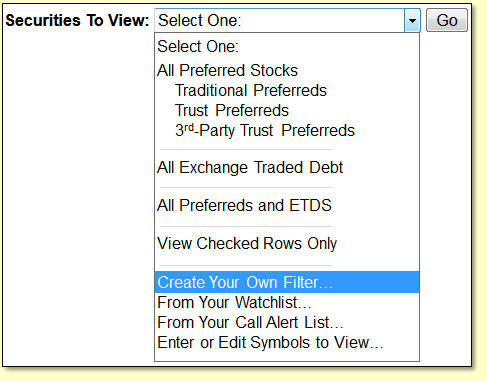
Using the Securities To
View drop-down list, you can see that Preferred Stock ListTM has a total of ten options for loading
securities into the View Table.
The first six (All Preferred Stocks, Traditional
Preferreds, Trust Preferreds, 3rd-Party Trust Preferreds, All Exchange
Traded Debt, All Preferreds And ETDS) are pre-defined while the last
five (View Checked Rows Only, Create Your Own Filter, From Your
Watchlist, From Your Call Alert List and Enter or Edit Symbols To View)
allow you to control which specific securities are displayed.
To make a selection from the Securities To View drop-down
list, just click on your selection then click the Go button.
When the data you have requested is initially displayed in the View
Table it will be sorted by IPO Date. Data loading times vary with
browser and connection speed.
 Let's load some data
into the View Table. Let's load some data
into the View Table.
Click the small down-arrow to drop down the list of
Securities To View, click Traditional Preferreds then click the Go
button.
All traditional preferred stocks trading on U.S. stock
exchanges will load into the View Table.
Your web browser will display indicators that Preferred
Stock ListTM is
loading data. Depending on which web browser you are using (Internet
Explorer, Firefox, Safari, etc.), these indicators are slightly
different. Most display a message at the bottom of the screen while
data is being loaded along with some type of animated spinning graphic.
Clicking screen objects during the data download process will slow (and
perhaps even terminate) the task, so please be patient and wait until
all of the loading indicators and messages that your browser presents
have disappeared.
Loading the View Table with Traditional Preferreds takes
about 5 seconds before it is completely finished.
Now that we have some data in the View Table, let's
review a few of the program's features. After that we'll go over how to
save data from the View Table onto your computer.
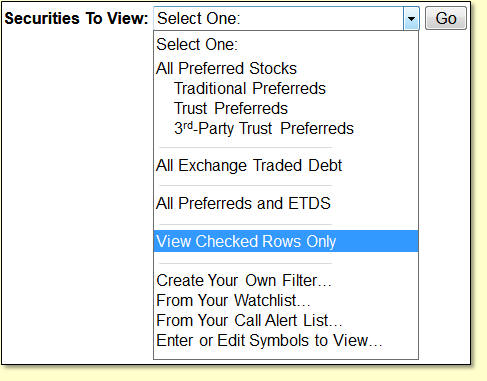
The View Checked Rows Only option works in combination
with the checkboxes that you see at the front of each preferred stock
row in the View Table.
 Using this option is
a two-step process. Using this option is
a two-step process.
First, select the individual preferred stocks that you
are interested in by clicking on the checkbox in front of each row.
Once you have checked the preferred stocks of interest,
select the View Checked Rows Only option and click the Go button.
After confirming that you want to view just the checked
rows, the View Table will refresh and present just the preferred stocks
that you selected with the checkboxes.
Before proceeding with an example of how to use
checkboxes, load the View Table with "All Preferreds and ETDS" (select
it from the drop-down list and click the Go button).
With All Preferreds and ETDS loaded into the View Table,
let's look at an example of using checkboxes.
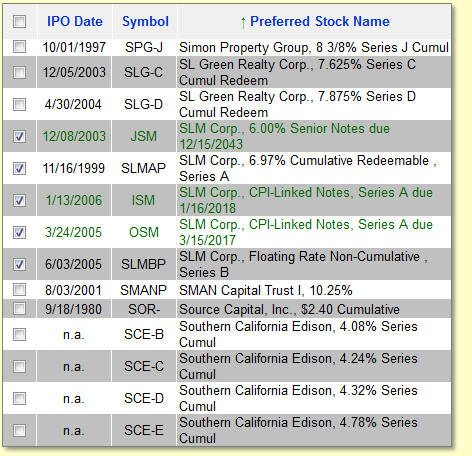
Let's say you are interested in securities issued by SLM
Corporation. To group them together, sort the View Table by the
Preferred Stock Name column (click the column heading), then click the
checkboxes next to each SLM security as seen here.
Notice in this example that some of the rows are black
and some are green. Preferred Stock ListTM uses
black for preferred stocks and green for Exchange Traded Debt
Securities. SLM Corporation has issued both types of these fixed-income
securities.
With the checkboxes of the rows that you are interested
in checked, selecting the View Checked Rows Only option in the
Securities To View drop-down list refreshes the View Table with just
the securities that you have checked.
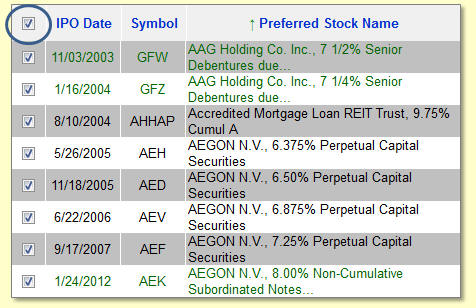 Before
we leave our discussion of using the checkboxes, notice the checkbox in
the upper-left corner next to the IPO Date column heading. Before
we leave our discussion of using the checkboxes, notice the checkbox in
the upper-left corner next to the IPO Date column heading.
This "master checkbox" allows you to check or uncheck all
rows in the View Table at once. This feature can be particularly handy
when you want to check all rows except just a few.
By clicking the master checkbox, all rows in the View
Table will become checked. You can then uncheck the specific rows you
want to remove.
Clicking the master checkbox a second time unchecks all
rows.
 While there are only
three types of preferred stocks (traditional, trust and 3rd-party
trust), each security can have a variety of characteristics as
specified in the prospectus. And the same is true for Exchange Traded
Debt Securities (ETDs). While there are only
three types of preferred stocks (traditional, trust and 3rd-party
trust), each security can have a variety of characteristics as
specified in the prospectus. And the same is true for Exchange Traded
Debt Securities (ETDs).
The Create Your Own Filter option allows you to use up to
twenty-five characteristics of preferred stocks and ETDs to create your
own filter.
For example, you can generate a list of all investment
grade preferred stocks with cumulative dividends that are currently
trading for a market price that is below their $25 par value. Or you
can see all non-cumulative preferred stocks that have an investment
grade rating from Moody's and S&P with a current yield over 7%. Or
you can produce a list of all preferred stocks and ETDs that are issued
by real estate companies (REITs) with a market price in a certain
range.
The combinations are endless. Since each of the
characteristics seen here have multiple values to pick from, you can
tighten your filter down as much, or as little, as you would like in
order to see just the securities that you are interested in.
Creating A Filter
The following page will appear when you select the Create
Your Own Filter option from the Securities To View drop-down menu.
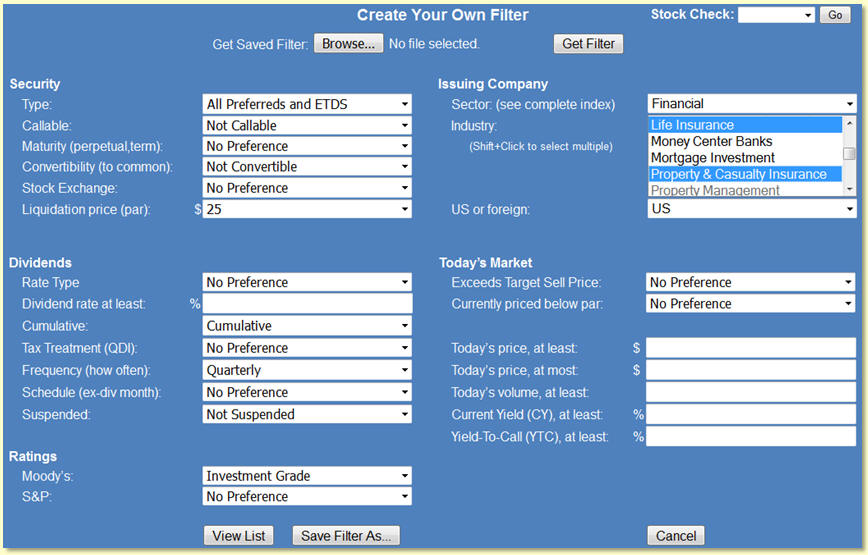
To create a filter, use the field next to each parameter
to specify the desired value. You can specify as many or as few
criteria as you would like.
Most of the values that you can select from are
self-explanatory but here are a few tips that should make using the
Create Your Own Filter page a snap.
Dollar amounts are entered without the dollar sign
and without any commas. For example, if you wanted to see securities
that have a current market price of at least a thousand dollars you
would enter 1000.00 in the "Today's price, at least" field.
Percentages are entered without the percent sign
(%). For example, if you wanted to see securities that have a coupon
value of at least 6.5 percent you would type 6.5 for the "Dividend rate
at least" value.
Industry/Sector classifications follow the simplified Morningstar classification
index as implemented at Yahoo Finance. Every security in our
Preferred Stock ListTM database includes this
coding for the issuing company's business sector and industry. When you
select a sector on the Create Your Own Filter page, the industry list
will automatically populate with the industries for the sector you
selected. While the industry list will include all of the industries
for the selected sector, industries that have no preferred stocks will
appear in gray font and cannot be selected. Gray font means that there
are no preferred stocks from that industry. To select multiple
industries, hold the [shift] key down on your keyboard while clicking.
Another tip: Be careful not to create a filter that
includes criteria that are mutually exclusive. Such a filter will
result in a list of zero securities. For example, say you set the
"Today's price, at least" value to 10.00 dollars but then set the
"Today's price, at most" value to 5.00 dollars. These two criteria are
mutually exclusive and would result in a list of zero securities.
Once you have your filter set up, click on the View List
button in the bottom-left corner and PSL will present the list of all
securities that meet the criteria that you have specified.
About List
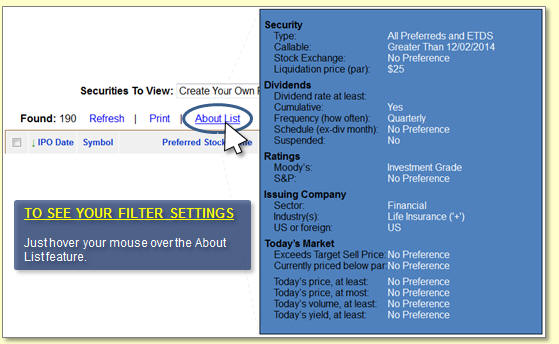
When viewing the securities from your filter, you will
notice that an additional feature appears to the left just above the
column headings.
The About List feature allows you to see the parameters
of your filter without having to return to the Create Your Own Filter
page.
Just hover your mouse over the About List feature and a
pop-up box will open on your screen with the values of your filter that
generated the list.
Note that the About List feature only appears when you
are viewing a list that was generated by the Create Your Filter page.
Returning To Your Filter
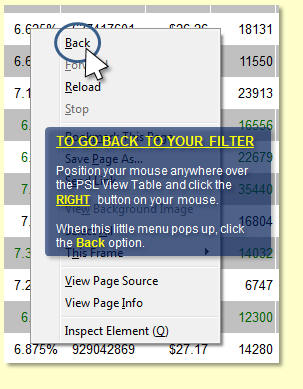
Once you specify the parameters of your filter and click
the View List button, the securities that qualify for your filter will
be presented.
Your web browser program (Internet Explorer, FireFox,
Safari) has a built-in feature that allows you to return to the filter
page in order to re-visit your parameters.
To return to the Create Your Own Filter page and re-visit
your parameters, position your mouse pointer anywhere within the PSL
frame and RIGHT click your mouse.
Clicking on your RIGHT mouse button will
open a small menu on your screen that includes a Back option. Clicking
the Back option will return you to the Create Your Own Filter page with
your parameters.
Please note that the Back/Previous arrow button located
in the upper-left corner of your web browser window will NOT return you
to your filter page. Use the Back function described in the above
paragraphs instead.
Once you have returned to your filter page and have
reviewed or modified your filter, click on the View List button to see
your list of securities again.
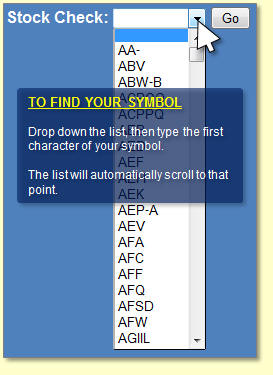
Stock Check
 The Create Your Own
Filter page also provides a "Stock Check" feature in the upper-right
corner of the page. The Stock Check feature allows you to see the
characteristics for a specific preferred stock or ETDs. The Create Your Own
Filter page also provides a "Stock Check" feature in the upper-right
corner of the page. The Stock Check feature allows you to see the
characteristics for a specific preferred stock or ETDs.
To use the Stock Check feature, click the small
down-arrow to drop down the list of securities in the PSL database. To
find the security that you are interested in, type the first letter of
its trading symbol and the list will automatically scroll to that
point. Click on the trading symbol for your security then click the Go
button.
The characteristics of the security that you selected
will be displayed.
Upgrade Candidates
Preferred Stock Investing
describes a technique called "upgrading" that allows you to "trade in"
a low dividend paying preferred stock for a higher paying one and have
cash left over when you're done. When upgrading, you will sell your
low-payer and use the proceeds to purchase a higher payer that is
selling for a lower market price than the one you sold.
The Stock Check feature makes finding upgrade candidates
a snap for any preferred stock in your portfolio.
For example, let's say that you own PSA-R from Public
Storage. PSA-R pays a 6.35% dividend (coupon) and is selling for $27.49
(on the day this was written). Use the Stock Check field to retrieve
PSA-R. With PSA-R's characteristics displayed, clear some of the fields
so that the filter is not overly restrictive - when performing an
upgrade what you really want to see is a list of candidates that have a
higher dividend rate and are available for a lower price than the
security you are selling (PSA-R here).
In this example, to see more candidates the following
fields from PSA-R were changed to 'No Preference' or set to blank -
Callable, Schedule, Sector/Industry, Currently priced below par,
Today's volume and Today's yield.
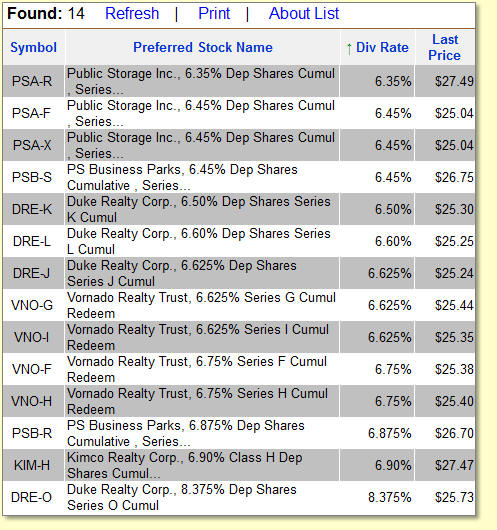
Clicking the View List button will display your upgrade
candidates.
PSA-R meets the characteristics of your filter so it is
listed along with 13 other upgrade candidates (this list is sorted by
Div Rate by clicking on the column heading).
If you sell PSA-R for $27.49, you could buy any one of
the other 13 securities seen in the list and (a) realize an increase in
dividend income and (b) have cash left over since they are all selling
for market prices less than PSA-R's $27.49.
Take a look at DRE-O at the bottom of the list. By
selling PSA-R for $27.49 and using the proceeds to buy DRE-O, you would
increase your dividend return to 8.375% (up from PSA-R's 6.35%) and
have $1.76 per share left over in your brokerage cash account. Whether
or not doing so is consistent with your personal financial goals,
resources and risk tolerance is, of course, a decision that only you
can make.
Using the Stock Check feature is an extremely powerful
way to identify upgrade candidates at any time for the preferred stocks
in your portfolio.
Saving Your Filter
 Clicking the Save
Filter As button at the bottom of the page allows you to save your
filter to your computer's hard disk. Clicking the Save
Filter As button at the bottom of the page allows you to save your
filter to your computer's hard disk.
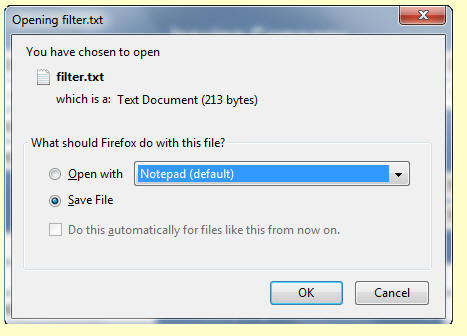
When you click the Save Filter As button, your web
browser program (Internet Explorer, FireFox, Safari) takes over from
our program so the appearance and function of these windows depends on
which web browser program you are using, your computer's operating
system and how you have the preference and other security settings
configured. Our program tells your web browser program to save the
filter file; how it does so is entirely up to your web browser program.
The example at left is from FireFox for Windows.
If you are having difficulty saving the filter file to
your computer, please seek the assistance of a local technical resource
who can work with you to properly configure the technical settings and
preferences of your computer web browser and/or operating system to
properly perform this function.
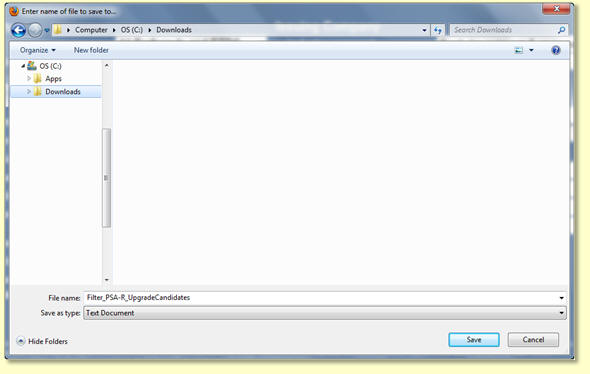 By clicking the Save
File radio button then the OK button, FireFox (in this example) will
present the Save As window that allows you to set your filter file's
name and the location (folder) on your computer's hard disk. By clicking the Save
File radio button then the OK button, FireFox (in this example) will
present the Save As window that allows you to set your filter file's
name and the location (folder) on your computer's hard disk.
The file type is set to use the plain text (.txt) format
which is the format required for filter files. Changing the file type
will prohibit your filter file from being able to be used by the Get
Saved Filter feature. Please do not change the file type when
saving your filter file.
Remember where you save your filter file since you will
need this information again when you want to retrieve your filter using
the Get Saved Filter button.
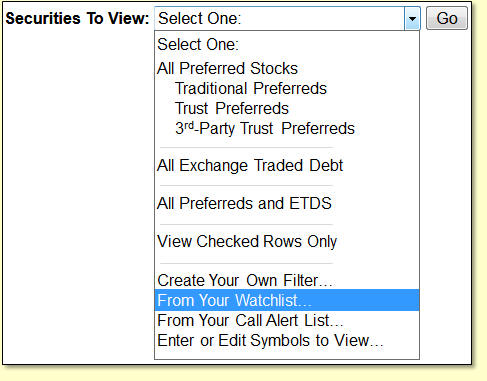 The From Your
Watchlist option tells Preferred Stock ListTM
that you want it to gather current data for a specific list of trading
symbols that you had previously saved onto your computer (more on how
to save a Symbol Watchlist of trading symbols onto your computer in a
moment). The From Your
Watchlist option tells Preferred Stock ListTM
that you want it to gather current data for a specific list of trading
symbols that you had previously saved onto your computer (more on how
to save a Symbol Watchlist of trading symbols onto your computer in a
moment).
This option is very helpful when you want to keep an eye
on a specific list of preferred stocks over time, such as a preferred
stock portfolio.
Even if your list includes CDx3 Preferred Stocks,
non-CDx3 issues and ETDS's, you can create a Symbol Watchlist of their
trading symbols (more on how to create a new Symbol Watchlist in a
moment) and load them into the View Table at any time.
When you select the From Your Watchlist option and click
the Go button, a window will open on your screen that allows you to
designate the file on your computer where you previously saved your
Symbol Watchlist (you can create any number of Symbol Watchlists as
long as you give them unique names on your computer; more on creating
Symbol Watchlists in a moment).
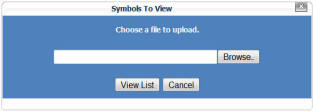
Note that the appearance of this window may be slightly
different depending on the web browser program you are using (Internet
Explorer, Apple Safari, Firefox, etc.).
Use this window to browse your computer's hard disk and
locate the Symbol Watchlist file that you had previously saved (using
the Save
As / Symbol Watchlist option discussed below).
A Symbol Watchlist file contains a list of preferred
stock trading symbols, separated by commas.
Once you have selected the Symbol Watchlist that you want
to view click the View List button. After Preferred Stock ListTM retrieves the data (this may take several seconds)
your screen will be updated with the preferred stocks designated by the
trading symbols within your Symbol Watchlist file.
With your preferred stocks listed, you can also make
changes to your watchlist - add some new symbols, delete others, etc.
To make changes to your symbol watchlist, use the Enter or Edit
Symbols to View option, discussed below.
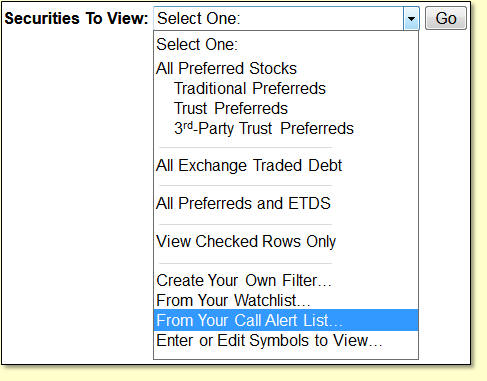
CDx3 Notification Service subscribers are able to create
a 'Call Alert List' of trading symbols. When the issuing company of one
of the securities on your Call Alert List announces a call, you will
receive an email notification from us for that security.
This feature is only available to CDx3 Notification
Service subscribers (when selected, you will be asked to
re-authenticate by entering your CDx3 Notification Service subscription
credentials).
The From Your Call Alert List option tells Preferred
Stock ListTM to retrieve the Call Alert List that
you previously saved in our system (using the Save As /
Call Alert List feature discussed below).
Once the securities within your Call Alert List are
displayed, you can edit the list (add new symbols, delete or change
existing symbols) using the Enter or Edit Symbols to View option
(discussed next).
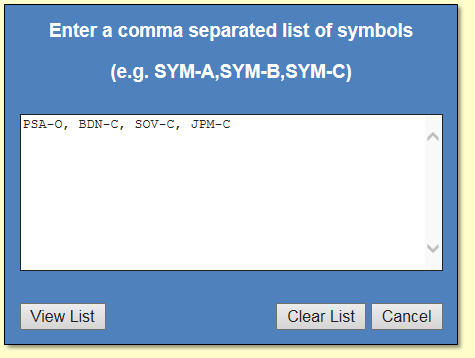
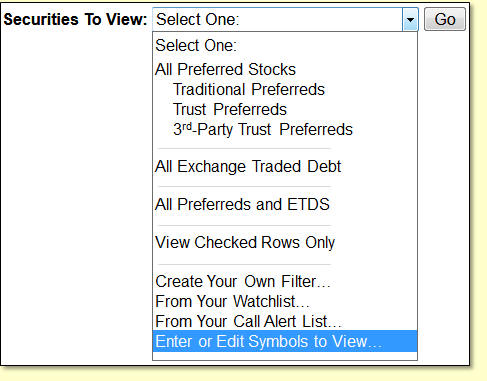 When you select the
Enter or Edit Symbols To View option and click the Go button, a page
will open on your screen where you are able to manually designate which
preferred stocks you would like to list, using their trading symbols. When you select the
Enter or Edit Symbols To View option and click the Go button, a page
will open on your screen where you are able to manually designate which
preferred stocks you would like to list, using their trading symbols.
If you are using this option to set up a long Call Alert
List for the first time (lots of symbols you don't particularly want to
type), see the special time saving tips below.
If you were viewing a list of preferred stocks at the
time you selected this option (from a Symbol Watchlist or from your
Call Alert List, for example), the trading symbols of the preferred
stocks you were viewing will automatically appear in the edit box on
this page.
Use the edit box to make any additions, deletions or
other edits to the trading symbols listed there or click the Clear List
button to start over with a clean slate.
Be sure that the trading symbols in the edit box are
separated by commas.
 You
can have as few or as many symbols in the edit box as you would like
but remember that the more you enter the longer it will take Preferred
Stock ListTM to gather all of the information.
Trading symbols can be entered either in UPPERCASE or lowercase letters
and can be for either preferred stocks, ETDS's or both. You
can have as few or as many symbols in the edit box as you would like
but remember that the more you enter the longer it will take Preferred
Stock ListTM to gather all of the information.
Trading symbols can be entered either in UPPERCASE or lowercase letters
and can be for either preferred stocks, ETDS's or both.
In this example, the View Table will be loaded with the
information for four preferred stocks - PSA-O, BDN-C, SOV-C and JPM-C.
Once you have typed your symbol list, click the View List
button. After Preferred Stock ListTM retrieves
the data (this may take several seconds) your screen will be updated
with the data for the securities designated by the trading symbols in
the edit box.
Invalid trading symbols will be ignored.
If you have just used the Enter or Edit Symbols to View
option to make changes to a Symbol Watchlist or to your Call Alert
List, don't forget to use the Save As / Symbol Watchlist or Save As /
Call Alert List feature (discussed below) to re-save your newly
updated list.
Here are some time saving tips for creating your Call
Alert List for the first time:
The first time you set up your Call Alert List, you are
likely to have quite a few trading symbols to enter. PSL provides three
methods for creating your Call Alert List, depending on how much typing
you want to do:
Method #1 - Type them using the Enter or Edit Symbols to
View option as discussed above.
Method #2 - List all of the preferred stocks and ETDS in
our database (alphabetically by trading symbol), then use the
checkboxes seen at the beginning of each preferred stock row for the
ones you want alerts for:
- Select the 'All Preferreds and ETDS' option of the
Securities To View drop-down menu (click Go).
- Sort the list by the Symbol column (click the column
heading). The list is now sorted by trading symbol, A to Z.
- Scroll down the list, clicking on the checkbox at the
beginning of each row for the securities you want call alerts for.
- With your securities checked, select the 'View Checked Rows
Only' option of the Securities To View drop-down menu.
The securities (rows) you checked are now displayed in
the View Table. Review your list of securities. If you need to make any
additions or changes, select the 'Enter or Edit Symbols to View' option
and edit your list of symbols. Once your list is the way you want it,
save it as your Call Alert List by selecting the 'Call Alert List'
option on the Save As drop-down menu.
Method #3 - Import your trading symbol list from an Excel
spreadsheet file (csv format). This tip is just for those who are
proficient with using a spreadsheet program (e.g. Excel) to create a
csv file. PSL's 'Securities To View / From Your Watchlist'
option will import a csv file of trading symbols from your computer
directly into the View Table. At that point, you can use the Save As /
Call Alert List option to save your Call Alert List. When using
your spreadsheet program to create a csv file of your trading symbols,
be sure that your trading symbols are all on row 1 across your screen
(one symbol per cell; no other content), left to right horizontally
(NOT as a column down your screen vertically, see special note below).
With your symbols now displayed across your screen on row 1 of your new
spreadsheet, save your new spreadsheet as a csv file type. To turn your
csv into a Call Alert List:
- Select the 'From Your Watchlist' option of the
Securities To View drop-down menu (click Go).
- Browse your computer and select your csv file of
trading symbols.
- Click the View List button to display the preferred
stocks from your csv file in PSL's View Table.
- Use the 'Call Alert List' option on the Save As
drop-down menu to save your preferred stocks as your Call Alert List.
Special note: If you currently have your preferred stocks
in a spreadsheet, but your trading symbols are oriented vertically (as
a column), use Excel's 'transpose' option on the Paste Special dialog
box to copy/paste your symbol column into cell A1 as a row in a new
spreadsheet.
'Hover and Click' Features
It's just not possible to
display all of the information that the PSL database contains or
otherwise has access to on one screen. By using what we call 'hover and
click' features, you are able to easily and quickly drill down into
vast amounts of additional information about specific preferred stocks
without having to navigate to some other webpage.
All of our hover and click
features work the same way. As explained below, certain (not all)
values that you see on a preferred stock's row in the View Table are
actually spring-loaded with additional information. To access the
additional information you can hover your mouse pointer
(without clicking) over such values and a small pop-up box will appear
with more detail.
Some values also let you
click on them to drill down even further. Clicking your
mouse on such values will open a new tab in your web browser with the
detailed content for the value you clicked on.
Let's take a look at the
hover and click features of our PSL database system, moving from left
to right across the View Table columns.
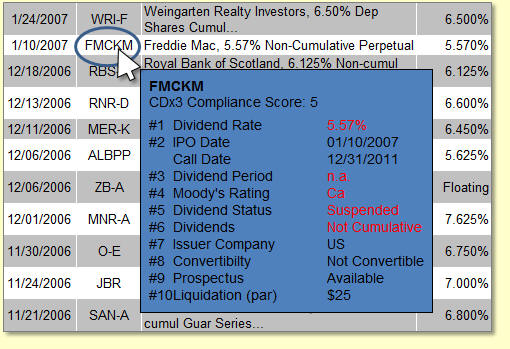
Hovering your mouse (without clicking) over
any trading symbol presents a pop-up box that displays the security's
"CDx3 Compliance Score." You can also click the symbol to open its Spec Sheet in a separate window.
The CDx3 Compliance Score is an indicator of the
security's quality. Preferred Stock Investing
describes a filter used to identify the highest quality preferred
stocks.
The "CDx3 Selection Criteria" filter is composed of ten
specific characteristics. Each security in our Preferred Stock ListTM database has a CDx3 Compliance Score (1 through 10)
that indicates how many of the ten CDx3 Selection Criteria the security
is able to meet.
Securities that are able to meet all ten of the CDx3
Selection Criteria ("CDx3 Preferred Stocks") have a CDx3 Compliance
Score of 10.
This example shows the CDx3 Compliance Score (a very weak
5) for FMCKN, a non-cumulative preferred stock from Freddie Mac with
suspended dividends.
Preferred Stock ListTM displays a
variety of current market data for every preferred stock such as the
last trade price, today's trading volume, current yield and the most
recently declared ex-dividend date.
But there's more. There are two types of price charts
that you can view for each security - while one chart shows you a
detailed picture of today's price movement, the second chart is a very
comprehensive, customizable charting tool.
Chart #1 - Today's Price Movement: By hovering
your mouse pointer over the last price of a preferred stock, a pop-up
box will open on your screen showing a chart of today's price movement
(provided by Yahoo.com).
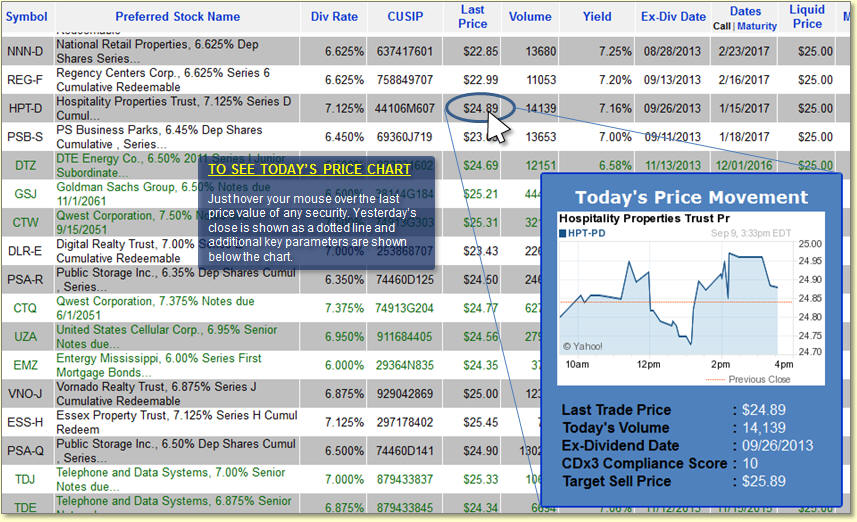
This example shows the price chart during a trading day
for the Series D preferred stock from Hospitality Properties (HPT-D).
The chart updates automatically throughout the trading day.
Below the chart are additional parameters that are useful
to those considering a purchase or a sale. Note too that the Target
Sell Price is also shown for CDx3-compliant securities (i.e. those with
a CDx3 Compliance Score of 10, see "Selling for the Target Sell Price"
described in Preferred Stock Investing).
Chart #2 - Customizable Chart with Dividend History:
While "hovering" your mouse pointer over the last price value displays
today's price movement, actually clicking on the last
price value will open a new tab in your web browser showing you the
price chart over the last year for the security you clicked on
(including the prior day's closing price).
Note that the security's dividend payments are indicated
with a "D" symbol. Payment dates without a D symbol indicated a missed
dividend payment. A security that pays a quarterly dividend should show
four D symbols when viewing a one year price chart as seen in this
example for HPT-D.
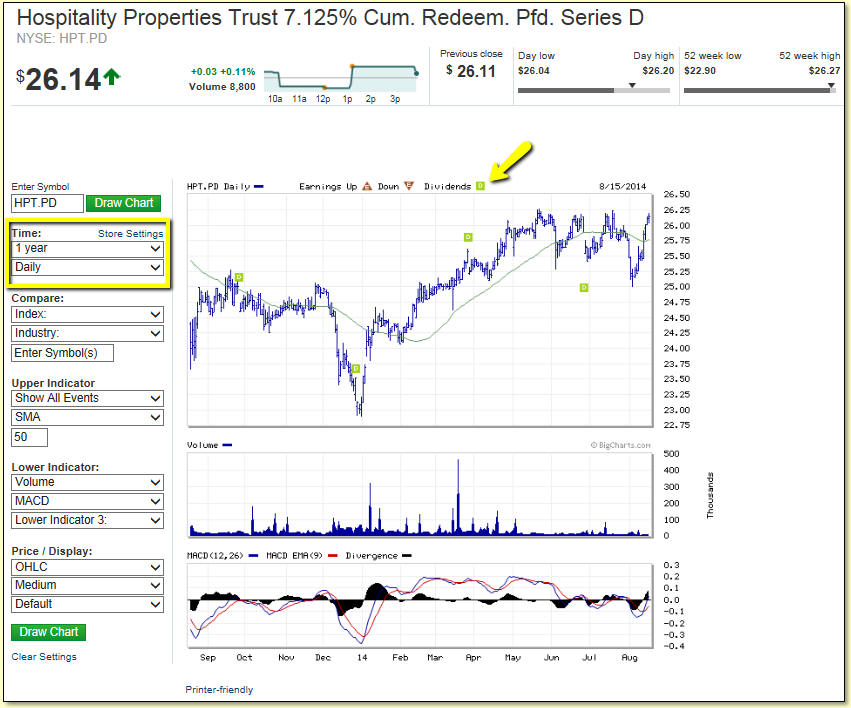
But this is much more than a one year price chart; the
page that you see is presented by MarketWatch.com (owned by the Wall
Street Journal) and is a very robust charting tool. By adjusting the
various settings that you see to the left of the chart, you can change
the date range of the chart, compare the price performance of multiple
securities or indexes, change the appearance of the chart, etc.
Not sure what some of the indicators mean? Do a Google
search like the phrase "what does MACD mean?" and you'll learn more
than you ever wanted to know.
Hovering your mouse pointer (without
clicking) over a value in the Yield column opens a pop-up box showing
the three rates of return for the security (Current Yield,
Yield-To-Call and Effective Annual Return).
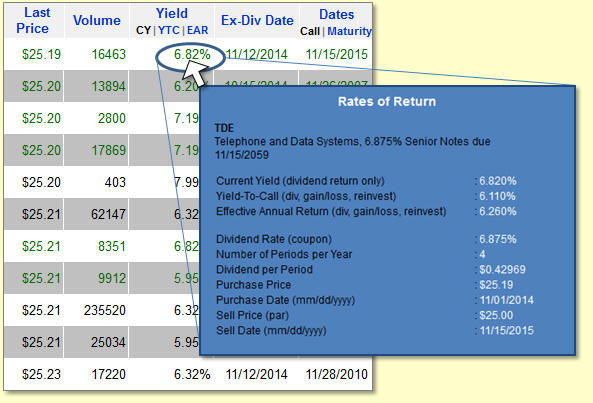
This example of the Yield hover feature shows the pop-up
box that appears when your mouse pointer hovers over the Yield value
for TDE from Telephone and Data Systems.
In addition to showing TDE's three rates of return (CY,
YTC and EAR), the pop-up box also shows the characteristics of the
security that are used in these three calculations.
If there are characteristics of the security that prevent
any of the three rates of return from being calculated, a red message
will appear next to the offending characteristic.
For example, neither YTC nor EAR can be calculated for
securities that have a call date that has passed. For such securities,
the message "Call date has passed" will appear in red font on the "Sell
Date (call date)" line.
Similarly, none of the three rates of return can be
calculated for securities where the last trade price (which is used for
the purchase price) is zero. In cases where the last trade price is
zero, "0.00" will be presented in red font on the "Purchase Price (last
price)" line. Also, the rates of return for preferred stocks that are
not paying dividends (suspended or deferred) cannot be calculated.
Clicking on a Yield value opens a new tab
in your web browser with our rate of return calculator. The Rates of
Return page is a very powerful tool for preferred stock investors and
goes well beyond the functionality of the simple rate calculators that
you may be used to.
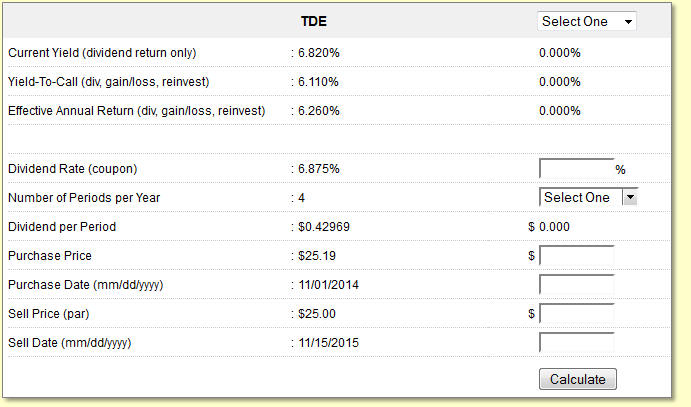 The Rates of Return
page is presented with two columns. The left column shows the rates of
return for the preferred stock that you clicked on along with the
characteristics that are used in the calculations (TDE in this
example). The Rates of Return
page is presented with two columns. The left column shows the rates of
return for the preferred stock that you clicked on along with the
characteristics that are used in the calculations (TDE in this
example).
The right column is used to select or create a preferred
stock investment that can then be compared to the one you clicked on,
side by side.
Selecting a second preferred stock: To compare a
second preferred stock's rates of return to the one that you clicked on
(presented in the left column), use the "Select One" drop-down list
that you see in the gray title bar.
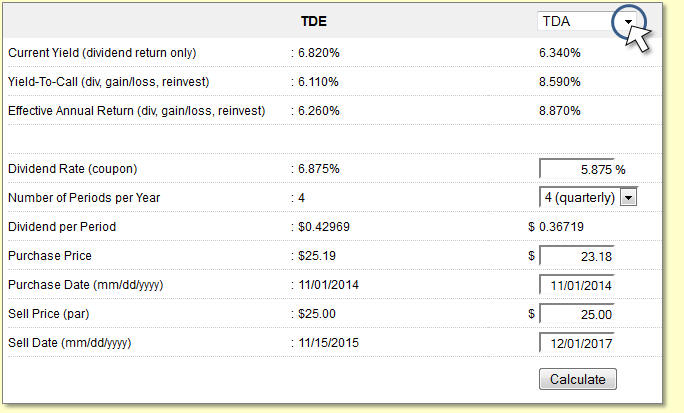
Clicking on the small down arrow of the Select One
drop-down list will display a scrolling list of the trading symbols for
all of the securities in our PSL database.
Clicking on a trading symbol will select that security
and display its three rates of return plus the characteristics that are
used in the calculations.
In this example, I have used the Select One drop-down
list to compare the rates of return for TDA, also issued by Telephone
and Data Systems, with TDE.
Creating a second preferred stock: Alternatively,
the right column also functions as a manual rate of return calculator.
Manually entering the six characteristics of a preferred stock
investment that you are considering allows you to compare the rates of
return with the preferred stock you clicked on (TDE in this example)
with the one you have manually set up.
 To
use the calculator, just enter the six values and click the Calculate
button. To
use the calculator, just enter the six values and click the Calculate
button.
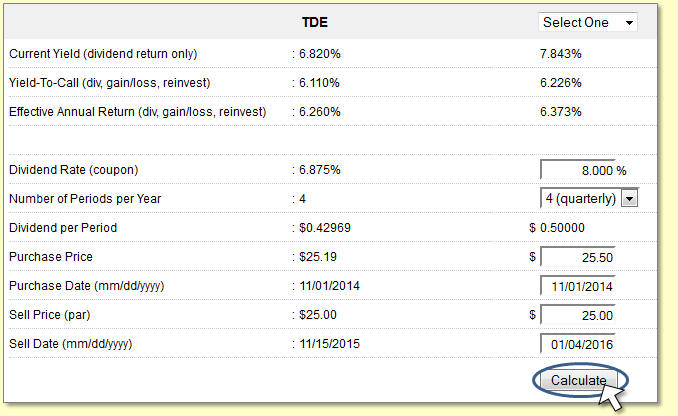
For example, let's say that I want to know if buying a
preferred stock with an 8 percent dividend at $0.50 over par ($25.50)
and holding it until January 2016 would provide me with a greater
Yield-To-Call than buying TDE shares today at $25.19.
After entering the six values for the 8 percent preferred
stock that I am considering, clicking the Calculate button presents the
Current Yield, Yield-To-Call and Effective Annual Return.
Notice that the YTC of our fictitious preferred stock
will be 6.226 percent compared to TDE's 6.110 percent. If YTC was the
only consideration, the calculator tells me that I would be better off
investing in the 8 percent alternative than buying TDE shares, even if
it means taking a larger capital loss in the event of a call in January
2016.
Hovering your mouse pointer (without
clicking) over an ex-dividend date opens a pop-up box showing key
information about the most recently declared dividend for the security
that your mouse is hovering over.
Take a look at this example of the hover feature using DDR-K from DDR
Corporation.
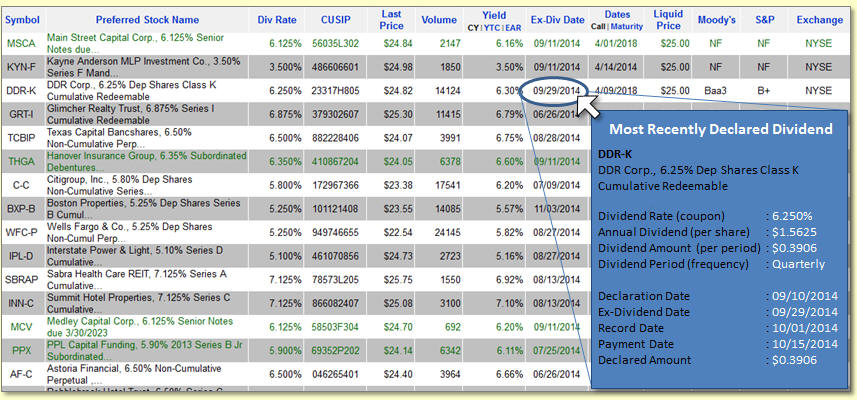
Clicking on the ex-dividend date opens a
new tab in your web browser displaying the dividend history for the
security you clicked on.
Working With Your List
When you use the Securities
To View drop-down menu to load preferred stocks into the View Table,
the PSL system allows you to perform a variety of common tasks such as
searching the list for a specific security or company, re-sorting the
list, refreshing the market data (such as the last price and volume) or
printing a hardcopy on your printer.
There are several methods that you can use to search the
PSL database for a specific security using the trading symbol, CUSIP,
company name or just about anything else.
Method #1: Using the Securities To View
drop-down menu, select the Enter or Edit Symbols to View
option. A page will open where you can enter a list of one or more
preferred stock symbols to find.
Method #2: With the list of securities that you
want to search displayed in the View Table, click on your browser's
Edit menu and use the Find option. A search box will open for you to
enter what you want to search for (e.g. a trading symbol, company name,
CUSIP or anything else). If the security you specified is found within
the displayed list, your browser will scroll the list to that
security's row and highlight it. If you want to search the entire PSL
database, use the Securities To View drop-down menu and select the 'All
Preferreds and ETDS' option to populate the View Table before
performing your search.
You can also use your browser's Find function from the
keyboard rather than using the Edit menu. Just hold your [ctrl] key
down and type the letter f. The search box will open where you can
enter the text to search for.
Method #3: The 'Create Your Own Filter' page allows
you to search the PSL database for preferred stocks that meet up to 25
characteristics or a specific preferred stock using its trading symbol.
To access the Create Your Own Filter page, use the Securities To View
drop-down menu and select the Create Your Own Filter option. The 'Stock Check'
feature seen in the upper-right corner of the Create Your Own Filter
page allows you to quickly retrieve the data associated with a specific
preferred stock.
Here's another tip: If you are looking for a list of
preferred stocks issued by a specific company, use 'The Companies' tab
that you see in the CDx3 Notification Service menu bar. The Companies
tab presents an alphabetized list of all companies that have preferred
stocks and ETDs currently trading on U.S. stock exchanges and shows the
list of securities issued by each company. You can also search the list
of companies seen on The Companies tab by common stock trading symbol.

Note that the column headings in the View Table are blue.
That means that you can click them to control how the View Table is
sorted.
When the preferred stocks that you request first appear
in the View Table they will be sorted by IPO Date (most recently
introduced issues will be listed first). Clicking any column heading
will sort the View Table in ascending order (smallest value first) by
the column you clicked. Clicking the column heading again will re-sort
the View Table again but in descending order.
Remember that Preferred Stock ListTM
is a data gathering tool rather than a data analysis tool. To perform
more complex sorting you should save the data as a spreadsheet and use
a spreadsheet program (such as Microsoft Excel, OpenOffice or similar).
We'll review how to save the View Table as a spreadsheet onto your
computer in a moment.
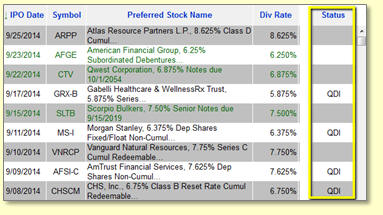 Income
securities that have been designated as having Qualified Dividend
Income (QDI) status are indicated in the Status column of our PSL
database with the letters "QDI". Income
securities that have been designated as having Qualified Dividend
Income (QDI) status are indicated in the Status column of our PSL
database with the letters "QDI".
The dividends that you receive from some preferred stocks
qualify for a special tax rate that is generally more favorable.
Dividend income that qualifies for this special tax treatment is
referred to as Qualified Dividend Income (QDI).
This example shows nine securities, four of which have
the QDI designation in the Status column (extraneous columns have been
removed here for clarity).
If you want to see all QDI securities in your list, just
sort your list by clicking on the Status column heading and all
QDI-designated securities in your list will group together for you.
Preferred stock investors should be careful to note that
even though the IRS is the enforcement agency when it comes to the QDI
designation of your dividend income, they have declined to publish an
official list of securities that are QDI-compliant. While the IRS
publishes the criteria for QDI compliance, they will not publish a list
of securities that meet those criteria. Rather, in the event of an
audit, the IRS will make a determination of any income you are claiming
to be QDI-qualified.
Consequently, please note the special footnote at the
bottom of the PSL frame which notes that the QDI designation that you
see in our PSL database (and from any other website or other source
other than the IRS) is unofficial and reminds you that you
should seek the advice of a tax professional regarding the QDI
compliance of your dividend income.
Those subscribed to our CDx3 Notification Service program
can quickly see a list of securities that are being called by their
issuer by clicking on the PS News tab on the CDx3 Notification Service
website. The PS News tab allows CDx3 Notification Service subscribers
to view IPOs and calls in one mouse click.
Our PSL program also allows you to see securities that
are being called. The Status column will display the word "Called" in
the event that the issuing company announces a call (a.k.a. redemption)
for the security. To see all securities in your list that have a call
pending, just sort your list by clicking on the Status column heading
and all called securities in your list will group together for you.
Similarly, to see all preferred stocks and ETDs
that currently have a call pending, use the Securities To View
drop-down menu to load "All Preferreds and ETDS" into the View Table
then sort the list by clicking on the Status column heading. All
securities with a pending redemption will be grouped together for you.
For securities with a pending call (i.e. where the word
"Called" appears in the Status column), the date seen in the security's
Call Date column will present the date of the announced redemption
(this is the date that the issuing company will purchase the shares
back from shareholders in exchange for cash).
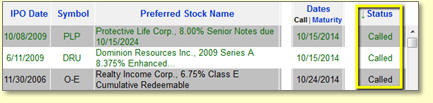 In this example, PLP
from Protective Life and DRU from Dominion Resources (both ETDs) have
been called for October 15, 2014. Realty Income has also announced the
redemption of its O-E traditional preferred stock for October 24,
2014 (extraneous columns have been removed here for clarity). In this example, PLP
from Protective Life and DRU from Dominion Resources (both ETDs) have
been called for October 15, 2014. Realty Income has also announced the
redemption of its O-E traditional preferred stock for October 24,
2014 (extraneous columns have been removed here for clarity).
Once a security is called and is no longer trading it is
removed from, and will no longer appear within, our PSL database.
The Status column will display the word "Suspended" or
the word "Deferred" in the unlikely event that the issuing company is
unable to make the upcoming dividend payment to shareholders.
The difference between a preferred stock with suspended
dividends and one with deferred dividends can become very important to
preferred stock investors so our PSL database program makes the
distinction clear in the Status column.
Prospectus language for preferred stocks with
"non-cumulative" dividends will often use the term "suspend" when
describing what happens if the company is not able to make dividend
payments (as in "...the company may suspend payment of
dividends..."). If the company is unable to pay a dividend for a
non-cumulative preferred stock, they have no obligation to make the
missed payment up in the future; the dividend is suspended
(cancelled).
Conversely, the prospectus of a preferred stock with
"cumulative" dividends will often use the term "cumulative" when
describing the conditions under which the issuing company is allowed to
skip a dividend payment to you. The term "defer" is also commonly used
(as in "...the company may defer payment of dividends...").
Preferred stocks that offer cumulative dividends are therefore viewed
as having less risk since, in the event that the issuing company skips
a dividend payment, they still owe you the money; their obligation to
pay you accumulates. Such skipped dividends can be deferred
(postponed), but, short of a bankruptcy, they cannot be suspended
(cancelled).
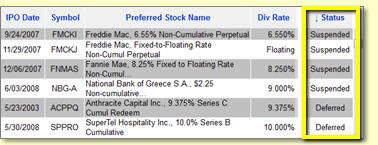
This example shows examples of cases where the issuing
companies of these securities have ceased paying dividends to
shareholders (extraneous columns have been removed here for clarity).
Looking at the description for the issues from Freddie
Mac, Fannie Mae and the National Bank of Greece, you can see that these
are/were non-cumulative securities so the PSL Status column uses the
term "Suspended."
Similarly, the securities listed here from Anthracite
Capital and SuperTel Hospitality offer cumulative dividends so the
Status column uses the word "Deferred" to indicate the status of these
dividends.
The three most common rate of return calculations used by
preferred stock investors are Current Yield (CY), Yield-To-Call (YTC)
and Effective Annual Return (EAR). Each calculation uses different
assumptions and tells you something different about your investment.
Current Yield: CY is the yield metric that you
see whenever you view an online quote for a dividend-paying security,
including dividend-paying common stocks and preferred stocks. The CY
calculation assumes that you purchase shares today at today's market
price (the Last Price column) and never sell them. CY also assumes that
the issuing company never redeems your shares (the shares are never
called); that is, you hold your shares and collect the dividend income
forever (no capital gain or loss is ever realized). Further, CY does
not account for any additional gains you might realize if you
reinvested your dividend cash. The CY calculation assumes that the
dividends you receive provide no value to you whatsoever (you drop the
checks in the nearest shredder).
Yield-To-Call: YTC calculates the annual rate of
return assuming that you purchase shares today at today's market price
(the Last Price column) and that you sell your shares (back to the
issuing company in the event of a call or on the open market) on the
security's call date (the Call Date column) for a sell price reflected
by the security's par value (the Liquid Price column). YTC is a more
comprehensive metric than CY because YTC not only includes the rate of
return on your dividend income, but YTC also accounts for any capital
gain or loss you realize when you sell your shares. Further, YTC
assumes that each dividend payment that you receive is reinvested in
something that provides value to you whether you spent the dividend
cash or buy more shares with it. The YTC formula uses 'discrete compounding' to calculate
your return on reinvested dividends.
Effective Annual Return: EAR is the most accurate
and realistic rate of return calculation for preferred stock
investments. EAR is similar to YTC but uses 'continuous compounding' rather than
discrete compounding in its calculation. Continuous compounding is a
method that allows the EAR calculation to reflect reality much more
closely since it captures more of the return on your reinvested
dividends than the discrete compounding method used by YTC (this also
means that the EAR value will always be higher than the YTC value).
Our Preferred Stock ListTM
database program allows subscribers to see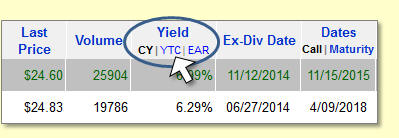 CY, YTC and EAR in
one mouse click. CY, YTC and EAR in
one mouse click.
By default, when a list of securities is displayed in the
View Table, the Yield column presents the Current Yield as indicated by
the letters "CY" seen in bold, black font just below the Yield column
heading.
To change the values in the Yield column to show
Yield-To-Call or Effective Annual Return, click on the letters "YTC" or
"EAR", respectively. Note that if you had previously sorted the View
Table by Yield, changing the type of yield calculation will change the
values in the column and the program will re-sort the list accordingly
using the new values.
Note that a value of "0.00%" will be presented for a
security when the yield calculation you have selected cannot be
calculated due to missing data. For example, neither Yield-To-Call nor
Effective Annual Return can be calculated for a security that has
already exceeded its call date. Similarly, "0.00%" will be displayed
for securities that have suspended or deferred dividends to
shareholders.
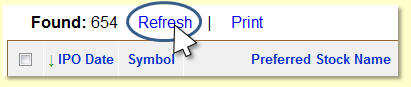
Just above the column headings on the left side of the
screen you will see a clickable feature that refreshes the data in the
View Table.
 Some of the data
presented in the View Table is "perishable," meaning that it can become
out-of-date very quickly. For example, the Last Price column is the
market price of the last trade that took place on the stock exchange
for each preferred stock. The Volume value is also very perishable
since it shows you how many shares have traded so far today. Such
perishable values change continually throughout the day so refreshing
the data is important (note that this data is delayed about 20 minutes;
confirm all data before considering investing). Some of the data
presented in the View Table is "perishable," meaning that it can become
out-of-date very quickly. For example, the Last Price column is the
market price of the last trade that took place on the stock exchange
for each preferred stock. The Volume value is also very perishable
since it shows you how many shares have traded so far today. Such
perishable values change continually throughout the day so refreshing
the data is important (note that this data is delayed about 20 minutes;
confirm all data before considering investing).
To refresh the data in the View Table click Refresh.
Whenever Refresh is clicked, Preferred Stock ListTM returns to the Internet and updates the information
associated with the currently displayed list of preferred stocks in the
View Table.
Just above the column headings on the left side of the
screen you will see a clickable feature that allows you to produce a
printed copy of the data in the View Table.
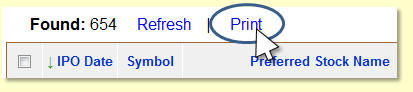 Clicking on Print
opens a new window on your screen with the View Table data presented in
a single table. In the upper-left corner of this new window is a Print
button that allows you to print the table on your printer. Clicking on Print
opens a new window on your screen with the View Table data presented in
a single table. In the upper-left corner of this new window is a Print
button that allows you to print the table on your printer.
'Save As' Drop-down Menu Functions
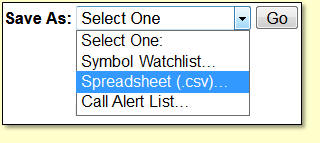
Once you have the preferred
stocks that you are interested in showing in the View Table, you can
save them in any one of three forms - (1) as a 'Symbol Watchlist' for
later retrieval (what some refer to as a 'portfolio') or (2) as a
spreadsheet, with all of the displayed data, to your computer for
further analysis or (3) as a 'Call Alert List' if you want to receive
an email notification when/if the issuing company announces a call for
any one of these securities.
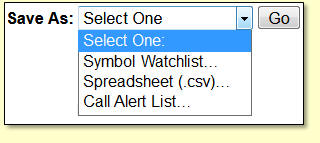
To see these three options
in the Save As drop-down menu click on the small down arrow.
A word of caution here: The
Save As / Symbol Watchlist feature and the Save As / Spreadsheet
feature involve downloading information to your computer and saving it
to your computer's hard disk. Doing so is entirely performed by your
web browser program (not our software). All web browsers perform the
task of downloading and saving a file to your computer differently. In
fact, depending on how you have your security settings configured, this
function may not work at all. Your web browser's security settings need
to be set such that downloading a file to your computer's hard disk is
allowed.
Some versions of Apple's web
browser (Safari) can be particularly picky about this and may disallow
saving a file to your computer as the default security setting when the
browser was installed onto your computer/device.
Before you attempt to save a
watchlist or spreadsheet file to your computer, be sure that your
browser's preferences and/or security settings do not block downloading
files. Your browser may not distinguish between cookies and any other
type of downloaded file so set your browser to never block
cookies.
Also, some browsers (such as
Safari) may preset the name of the folder on your computer that
downloaded files will be saved into (such as "Download" or
"Downloads"). If your browser is set to save downloaded files into a
specific folder, be sure that you know what that folder name is so that
you can find your downloaded watchlist or spreadsheet file later
(Safari users should look under Preferences/General).
Let's go over the three
options of PSL's Save As drop-down menu.
 It is important to
understand the difference between saving a Symbol Watchlist versus
saving a Spreadsheet. It is important to
understand the difference between saving a Symbol Watchlist versus
saving a Spreadsheet.
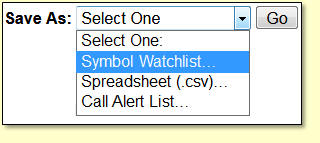
When you use the Save As / Symbol Watchlist option
Preferred Stock ListTM saves the trading symbols
- ONLY - to your computer's hard disk in a folder and Symbol Watchlist
file name that you specify.
A Symbol Watchlist is a list of preferred stock trading
symbols and does not include their data. If you want to save the data
associated with the trading symbols as well, use the Save As /
Spreadsheet option (discussed next).
The Save As / Symbol Watchlist option is great if you
have lists of preferred stocks that you frequently want to watch. You
can create and save as many Symbol Watchlists as you'd like, just be
sure to give them unique and meaningful names on your computer so that
you can tell them apart when reloading them later (see the Securities
To View / Symbol Watchlist discussion above).
When you select the Save As / Symbol Watchlist option
and click the Go button, a window will open asking you to confirm the
action you want to take.
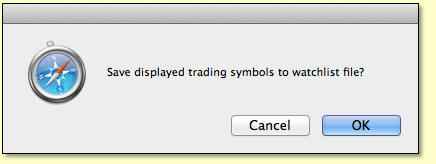 The appearance of
this window will be different depending on which web browser program
you are using and how you have some of your browser settings configured. The appearance of
this window will be different depending on which web browser program
you are using and how you have some of your browser settings configured.
The example at left is from Safari for Mac (once Safari
was configured to never block cookies using the
Preferences/Privacy/Block Cookies menu).
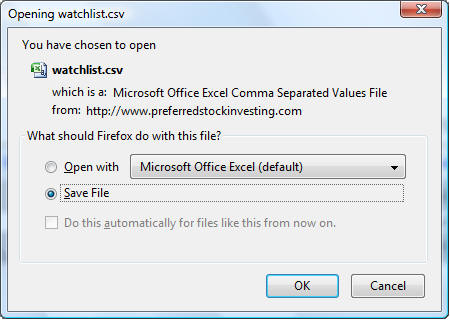 This example is from
Mozilla Firefox. For Firefox users, note the choices you are given
under the "What should Firefox do with this file?" question. This example is from
Mozilla Firefox. For Firefox users, note the choices you are given
under the "What should Firefox do with this file?" question.
Internet Explorer and other browsers produce a similar
Open or Save file confirmation screen.
Click Save File then the OK button.
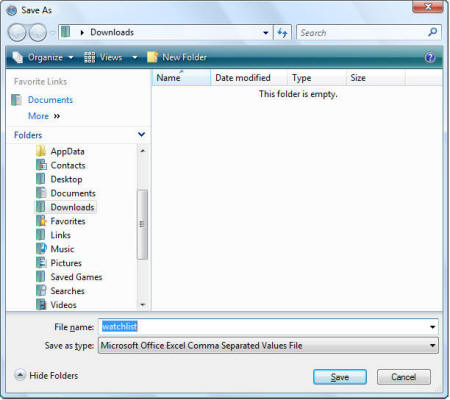
The Save As window will then appear, asking you to
designate where, on your computer, you would like to save this Symbol
Watchlist and under what file name.
Remember where you save it since you will need this
information again when you want to reload these preferred stocks into
PSL in the future.
By default, the file name is set to 'watchlist'. While
the file name can be changed to anything that is meaningful to you, do
not change the file type.
The file type is set to use the comma separated values
(CSV) format which is the format required for Symbol Watchlist files.
Changing the file type will prohibit your Symbol Watchlist file from
being able to be used by the Securities To View / Symbol Watchlist
option discussed earlier.
At some point in the future, you may want to make changes
to the trading symbols stored within a previously-saved Symbol
Watchlist. To make changes to the trading symbols within a symbol
watchlist file, retrieve your watchlist, make your changes, then
re-save it as follows:
- Use the Securities To View / Symbol Watchlist
option to retrieve the Symbol Watchlist file that you wish to make
changes to.
- With the preferred stocks from the watchlist displayed,
select the Securities To View / Enter or Edit Symbols to View option.
- The trading symbols from your watchlist will be listed
in the edit box. Make any changes to the symbol list.
- Click the View List button and PSL will display your
updated list of preferred stocks.
- With your updated list on your screen, use the Save As
/ Symbol Watchlist option to re-save your updated watchlist.
 This option allows
you to save the data currently being displayed in the View Table to
your computer for further analysis. All three yield values (CY, YTC and
EAR) are included in the saved file. This option allows
you to save the data currently being displayed in the View Table to
your computer for further analysis. All three yield values (CY, YTC and
EAR) are included in the saved file.
When you select this option you will be asked to
designate the folder and file name under which Preferred Stock ListTM is to save this data.
The resulting file is in a special "comma separated
values" (csv) format that can then be opened by common computer
spreadsheet software programs such as Microsoft Excel or OpenOffice (free download for PC and
Mac).
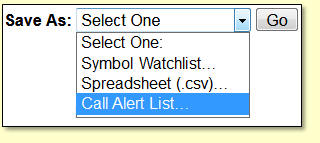 The Save As / Call
Alert List option allows CDx3 Notification Service subscribers to
receive email notifications whenever a call is announced for specific
preferred stocks or ETDS. The Save As / Call
Alert List option allows CDx3 Notification Service subscribers to
receive email notifications whenever a call is announced for specific
preferred stocks or ETDS.
This feature is only available to CDx3 Notification
Service subscribers (when selected, you will be asked to
re-authenticate by entering your CDx3 Notification Service subscription
credentials).
Using this feature, the securities currently listed in
the PSL View Table will be saved as your 'Call Alert List' in our
system under the email address associated with your CDx3 Notification
Service subscription (where you receive CDx3 email messages from us).
When the issuing company of one of the securities on your Call Alert
List announces a call, you will receive an email notification from us
for that security.
Note that the trading symbols within your Call Alert List
can only be for securities that have yet to be called. PSL's far-right
Status column will display the word 'Called' for securities that have
already been called. The Save As / Call Alert List function will ignore
symbols for securities that have already been called when your Call
Alert List is saved since the call alert has already been sent to
subscribers for these securities.
To delete your previously-saved Call Alert List from our
system, use the Save As / Call Alert List option when the View Table is
empty (no preferred stocks listed). Saving an empty Call Alert List
tells PSL to delete your Call Alert List, if any, from our system.
At some point in the future, you may want to make changes
to the trading symbols within your Call Alert List. To make changes to
the trading symbols within your Call Alert List, retrieve your Call
Alert List, make your changes, then re-save it as follows:
- Use the Securities To View / From Your Call
Alert List option to retrieve your Call Alert List.
- With the preferred stocks from your Call Alert List
displayed, select Securities To View / Enter or Edit
Symbols to View.
- The trading symbols from your Call Alert List will be
listed in the edit box. Make any changes to the symbol list.
- Click the View List button and PSL will display your
updated Call Alert List.
- With your updated list on your screen, use the Save As
/ Call Alert List option to re-save your updated Call Alert List.
The data displayed by Preferred Stock ListTM
is provided by suppliers who do not warrant the data's completeness,
timeliness or accuracy. Therefore, no such warranty is offered to you
with respect to your use of Preferred Stock ListTM
or the data it presents. Confirm all information presented by Preferred
Stock ListTM prior to making investing decisions.
|