|
CDx3
Notification Service Website - Trends
The Trends page on the CDx3 Notification Service website
is one of a kind. While there are lots of stock charting tools around,
this is the only one that is pre-loaded with metrics and data that is
specifically for preferred stock investors. And you can print your
chart or download our historical data, too.
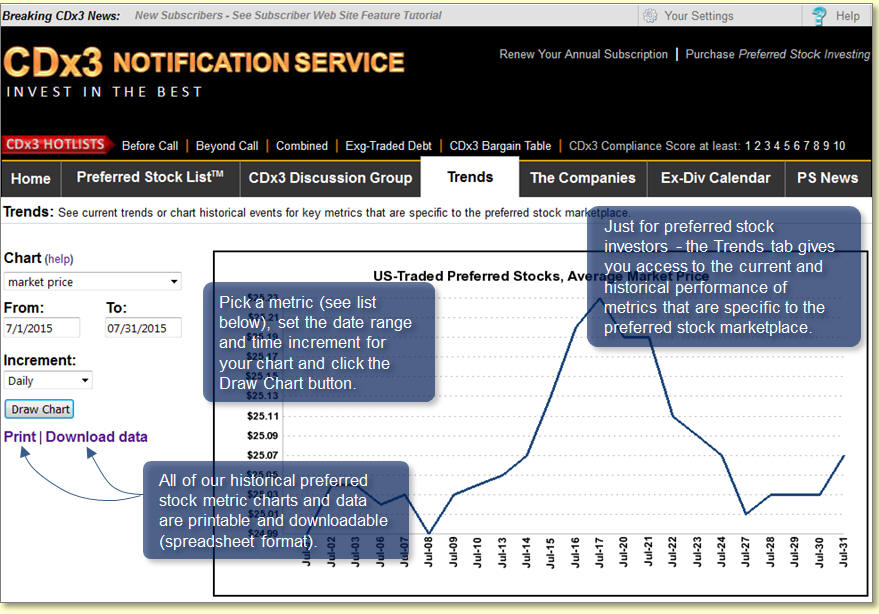
The Trends page allows subscribers to graphically view
current trends, as well as the historical performance, of a wide
variety of key metrics that are specific to the preferred stock
marketplace. Here's how this page works:
First, select the specific metric that you want to chart
using the Chart drop-down list. Just click on the little down-arrow and
the list of metrics available to be charted will appear in a scrolling
list.
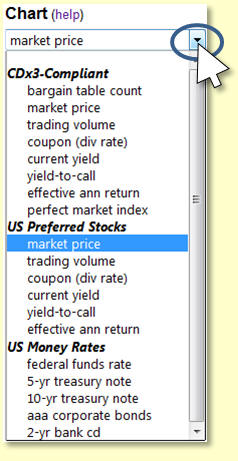
Notice how these metrics are specifically tailored to the
interests of preferred stock investors. You can view the historical
performance of U.S. preferred stock coupon rates, yield-to-call,
preferred stock trading volumes over time, U.S. money rates and much
more.
The metrics, which include data for U.S.-traded preferred
stocks and ETDs, are organized into three groups:
- CDx3-Compliant:
These metrics are for the highest quality preferred stocks trading on
U.S. stock exchanges
(those that are able to meet the ten selection criteria
documented in Preferred
Stock Investing). We have collected data on the
performance of these
special securities for many years and allow you to chart,
print and download
much of it here.
- US Preferred Stocks:
This group of metrics reflects the characteristics of the overall
U.S. preferred stock
marketplace, including CDx3-compliant and non-CDx3
compliant issues.
- US Money Rates:
These rates represent the "cost of money" at various levels
throughout the
U.S. economy, starting with the federal funds rate, moving up through
treasury notes
and finally AAA corporate bond and bank CD yields.
The above example selects the market price for U.S.
preferred stocks.
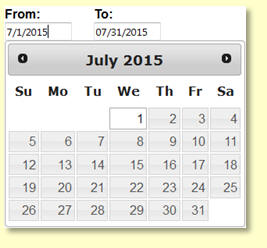 Now select
the date range for your chart by setting the From date and the To date.
You can either type in your dates or use the handy calendar tool that
will automatically appear when you click into a date field (and
disappear when you click out of a date field). Now select
the date range for your chart by setting the From date and the To date.
You can either type in your dates or use the handy calendar tool that
will automatically appear when you click into a date field (and
disappear when you click out of a date field).
The From date will default to the earliest date for which
our metrics database has data for the metric that you selected for your
chart. You can specify any From date you want as long as you do not
designate a From date that is earlier than the default value (the
oldest available data). Also, your From date cannot be greater (more
recent) than your To date.
Similarly, the To date can either be typed or you can use
the calendar tool that will automatically appear when you enter the To
date field. The To date defaults to today's date automatically, but you
can change it to any date you want as long as you do not specify a To
date that is prior to your From date or a To date that is in the future.
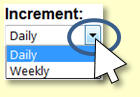
The Increment drop-down list will automatically populate
with a variety of time increments that you can select for your chart -
Daily, Weekly, Quarterly, Annually. The number of these increments that
are presented will depend on which metric and date range you have
specified for your chart (not all increments are available for all
metrics over every date range). The Increment drop-down list will
default to the most detailed time increment available for the metric
and date range that you have selected.
The example at the top of this page shows the daily
movement of the average market price of U.S. preferred stocks
(including ETDs) during July, 2015.
Below is a chart of historical interest to preferred
stock investors. This chart illustrates the average yield provided by
CDx3 Preferred Stocks (none of which have ever missed a dividend
payment) available on U.S. stock exchanges since January, 2001. The
massive returns realized during the Global Credit Crisis are hard to
miss on this chart.
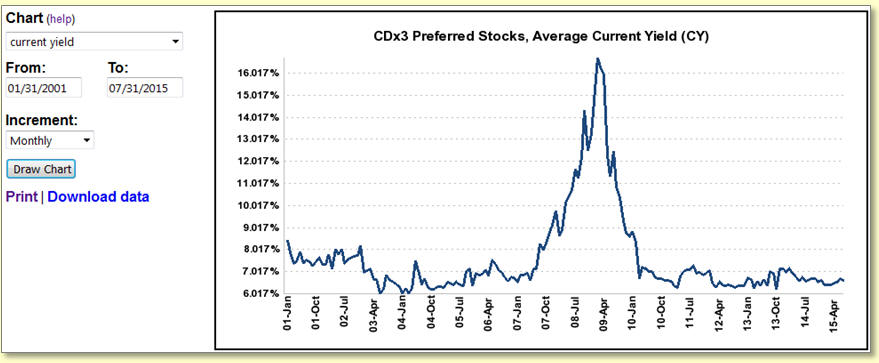
The crisis years provided the highest dividend income in
history, not to mention spectacular capital gains, to those following
the preferred stock selection and investing method described throughout
Preferred Stock Investing.
|